Intro
Ham radio hobbyists, as the former term indicate, have been all over the time great technicians, but with exceptions, never professionals on electrical or electronics works and related fields.
There are aspects of the radio where the hobbyists rub the professional turf. One of this aspects is antenna design. Until present, the biggest difference between a professional and a hobbyist was the amount of technology available to them, especially measurement equipment. General knowledge was already at hand, as books and encyclopaedias were available to both.
More in depth on antenna design, both professionals and hobbyist manage similar concepts, like SWR (stationary wave relationship), capacitance or inductance of circuits.
Nowadays, it’s easy to see a professional using expensive equipment, mostly software based, performing complex calculations, but, there was a point in time where those calculations were done manually using simple tools like a Smith Chart.
A bit of history
Smith charts were originally developed around 1940 by Phillip Smith as a useful tool for making the equations involved in transmission lines easier to manipulate. With modern computers and the use of software, the Smith chart is no longer used for the calculation of transmission line equations, however, their value in visualising the impedance of an antenna, or a transmission line, has not decreased.
The Smith chart is a graphical calculator, or nomogram, designed for electrical and electronics engineers specialising in radio frequency (RF) engineering to assist in solving problems with transmission lines and matching circuits. The use of the Smith chart, and the interpretation of the results obtained using it, requires a good understanding of AC circuit theory and transmission-line theory, both of which are prerequisites for RF engineers and, why not, for general radio hobbyists.
The Smith chart is a fantastic tool for visualising the impedance of a transmission line and antenna system as a function of frequency. Smith charts can be used to increase understanding of transmission lines and how they behave from an impedance viewpoint. Smith charts are also extremely helpful for impedance matching. The Smith chart is used to display an actual (physical) antenna’s impedance when measured on a Vector Network Analyser (VNA).
Network Analysers
In general, a network analyser is an instrument that measures the parameters of electrical networks. Analysers could be of two main types, Scalar Network Analyser (SNA), that measures amplitude properties only, and Vector Network Analyser (VNA), that measures both amplitude and phase properties.
A Vector Network Analyser (VNA) is a form of RF network analyser widely used for RF design applications. A VNA may also be called a gain–phase meter or an automatic network analyser. An SNA is functionally identical to a spectrum analyser in combination with a tracking generator.
Nowadays, VNAs are the most common type of network analysers, and so references to an unqualified “network analyser” most often mean a VNA.
With the advent of software and the cost reduction on materials crafted on China, entry-level devices and do-it-yourself projects have also been available, some for less than $100, mainly from the amateur radio sector. Although these have significantly reduced features compared to professional devices and offer only a limited range of functions, they are often sufficient for private users, especially during studies and for hobby applications up to the single-digit GHz range.
S-Parameters (scattering parameters)
Scattering parameters, or S-parameters, are popular in RF/Microwave circuit design and testing. Following are scattering parameters used for measuring/characterising an RF device.
From the Figure 1, beside, following two equations are derived:
b1 = S11 x a1 + S12 x a2 b2 = S21 x a1 + S22 x a2
S11 → Reflection coefficient at Port1 S22 → Reflection coefficient at Port2 S12 → Isolation (Reverse) S21 → Insertion loss (passive device case)

Figure 1: S-Parameters
S-parameters are vector entities which are derived from vector based measurements like magnitude or phase. Following scalar measurements are derived from S-parameters:
- Reflection and incident waves (S-parameters S11 & S22):
- Input SWR
- Return Loss
- VSWR
- Input / output impedance
- Reflection coefficient
- Transmission and incident waves (S-parameters S21 & S12):
- Gain / Insertion Loss
- Isolation
- Insertion phase
- Group delay
- Transmission coefficient
As you can see, S-parameters describe the input-output relationship between ports (or terminals) in an electrical system. For example, if we have 2 ports (intelligently called Port 1 and Port 2), then:
- S12 represents the power transferred from Port 2 to Port 1.
- S21 represents the power transferred from Port 1 to Port 2.
In general, Snm represents the power transferred from Port m to Port n in a multi-port network. These S-parameters are defined in terms of incident and reflected travelling waves.
As it was argued above, a port can be loosely defined as any place where we can deliver voltage and current. So, if we have a communication system with two radios (radio 1 and radio 2), then the radio terminals (which deliver power to the two antennas) would be the two ports:
- S11 then would be the reflected power radio 1 is trying to deliver to antenna 1.
- S22 would be the reflected power radio 2 is attempting to deliver to antenna 2.
- And S12 is the power from radio 2 that is delivered through antenna 1 to radio 1.
Note that, while operating with RF equipment, in general S-parameters are a function of frequency, i.e. vary with frequency. In these scenarios S-parameters are simple to use in analysis. As they are very easy to measure using network analysers, the popularity of the use of such parameters have been increased.
While working on RF with an analyser will see very often repeated some specific S-parameters which include:
- S11 / S22 —> reflection coefficient
- S12 —> Isolation
- S21 —> Insertion loss

In practice, the most commonly quoted parameter in regards to antennas is S11. S11 represents how much power is reflected from the antenna, and hence is known as the reflection coefficient, sometimes written as gamma or return loss.
- If S11 = 0 dB, then all the power is reflected from the antenna and nothing is radiated.
- If S11 = -10 dB, this implies that if 3 dB of power is delivered to the antenna, -7 dB is the reflected power.
The remainder of the power was “accepted by” or delivered to the antenna. This accepted power is either radiated or absorbed as losses within the antenna. Since antennas are typically designed to be low loss, ideally the majority of the power delivered to the antenna is radiated. The concept of VSWR is directly related to S11.
VNAs and S-parameters
A VNA is a test system that enables the RF performance of radio frequency and microwave devices to be characterised in terms of network scattering parameters, or S-parameters.
The diagram shows the essential parts of a typical 2-port vector network analyzer (VNA). The two ports of the device under test (DUT) are denoted port 1 (P1) and port 2 (P2). The test port connectors provided on the VNA itself are precision types which will normally have to be extended and connected to P1 and P2 using precision cables 1 and 2, PC1 and PC2 respectively and suitable connector adaptors A1 and A2 respectively.
Following the diagram on Figure 1, the test frequency is generated by a variable frequency CW source and its power level is set using a variable attenuator. The position of switch SW1 sets the direction that the test signal passes through the DUT. Initially consider that SW1 is at position 1 so that the test signal is incident on the DUT at P1 which is appropriate for measuring S11 and S21. The test signal is fed by SW1 to the common port of splitter 1, one arm (the reference channel) feeding a reference receiver for P1 (RX REF1) and the other (the test channel) connecting to P1 via the directional coupler DC1, PC1 and A1. The third port of DC1 couples off the power reflected from P1 via A1 and PC1, then feeding it to test receiver 1 (RX TEST1). Similarly, signals leaving P2 pass via A2, PC2 and DC2 to RX TEST2. RX REF1, RX TEST1, RX REF2 and RXTEST2 are known as coherent receivers as they share the same reference oscillator, and they are capable of measuring the test signal’s amplitude and phase at the test frequency.

Figure 1: The basic parts of a vector network analyser.
All of the complex receiver output signals are fed to a processor which does the mathematical processing and displays the chosen parameters and format on the phase and amplitude display.
The instantaneous value of phase includes both the temporal and spatial parts, but the former is removed by virtue of using 2 test channels, one as a reference and the other for measurement.
When SW1 is set to position 2, the test signals are applied to P2, the reference is measured by RX REF2, reflections from P2 are coupled off by DC2 and measured by RX TEST2 and signals leaving P1 are coupled off by DC1 and measured by RX TEST1. This position is appropriate for measuring S22 and S12.
NanoVNA
TBD
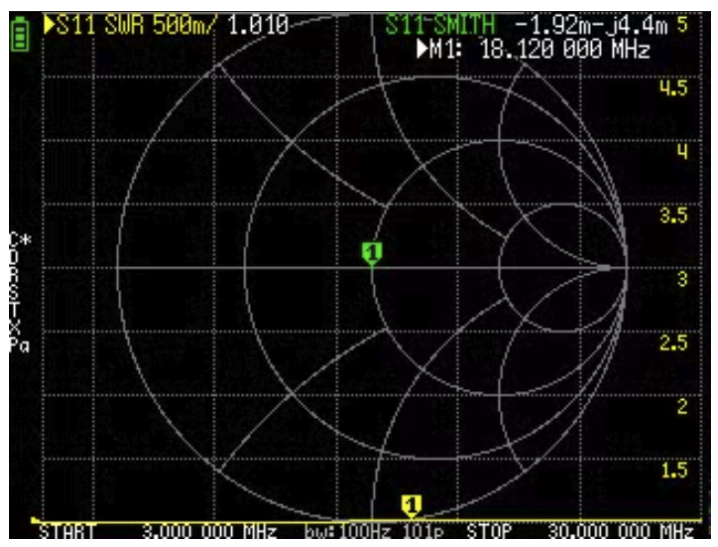
Figure 2: Smith chart representation from a NanoVNA device featuring S-parameters on two traces, trace 1 in SWR representation format, and trace 3 for Smith chart representation on R + LC representation
TBD